The months-long wildfires raging in Australia have killed at least 25 people. Millions — possibly 1 billion — animals have died. More than 2,000 houses have been destroyed. Around 150 fires are still burning in New South Wales and Queensland, with hot and dry conditions accompanied by strong winds fueling to the fires’ spread.
With this conflagration rocking the continent down under, satellite imagery has become important to understanding the scope of the disaster. Here are some of the recent captures.
As seen from the ISS
“Talking to my crew mates, we realized that none of us had ever seen fires at such terrifying scale,” European Space Agency astronaut Luca Parmitano tweeted on Monday, sharing photos taken from the International Space Station.
The astronaut posted images showing what he described as “an immense ash cloud” captured at the time the ISS was flying toward sunset.
An immense ash cloud covers Australia as we fly toward the sunset.
Una immensa nube di cenere copre l’Australia mentre voliamo verso il tramonto.#MissionBeyond pic.twitter.com/9Bmm9s4xa1
— Luca Parmitano (@astro_luca) January 13, 2020
Artist’s visualization misinterpreted
Another social media image, shared widely, was interpreted as a map showing the live extent of fire spread, with large sections of the populous eastern coastline molten red. Because of widespread misinterpretation, the original poster then explained that the image was a 3D visualization and not a photograph of Australia, and showed some areas where fires have been extinguished.
NASA and USGS Landsat images
NASA and the U.S. Geological Survey’s Landsat 8 satellite imagery from Jan. 9 shows Kangaroo Island, home to nature reserves. The images were taken using the Operational Land Imager (OLI) on Landsat 8. Using natural-color observations, the images show burned land and thick smoke covering the island, of which at least 156,000 hectares have burned.

Photo: NASA/USGS
The U.S. National Oceanic and Atmospheric Administration (NOAA) satellites are also capturing images, including the resulting plumes of smoke.
#GOESWest is watching this plume of #smoke from the #AustralianBushfires as it drifts across the #SouthPacific. It is nearly the size of the Continental #UnitedStates.
More real-time imagery: https://t.co/SNS92u2rBK#Australia #AustraliaFires #Bushfires #Fires #SmokePlume pic.twitter.com/B0MvtdYHf5— NOAA Satellites (@NOAASatellites) January 8, 2020
Worldview-3 captures Australia’s wildfires
Maxar collected satellite imagery Jan. 12 of the wildfires in New South Wales (NSW). The imagery shown below focuses on the area near the town of Eden, and demonstrates the value of the shortwave infrared (SWIR) sensor.
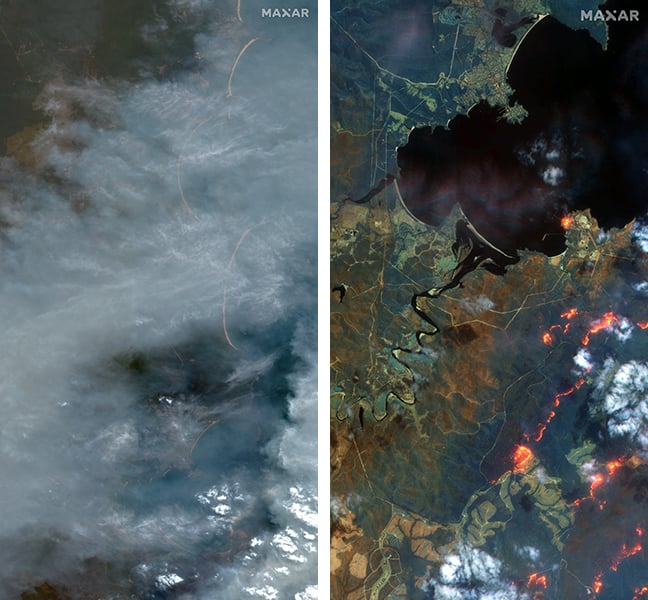
SWR satellite imagery of the town of Eden shows the wildfires through the smoke. (Satellite images ©2020 Maxar Technologies)
In an image taken with Maxar’s normal RGB color imagery, the smoky air prevents a clear view of the fires and the hot spots. With Maxar’s WorldView-3 satellite, however, the team is able to penetrate through the smoke using its SWIR sensor for a detailed look at the fire lines and burned vegetation.
With SWIR imagery, burning areas are apparent and show up in a glowing orange-red. Healthy vegetation shows up in shades of blue, and burned vegetation appears in shades of brown.
Satellite Photo: :ESA
Copernicus Sentinel-3 imagery
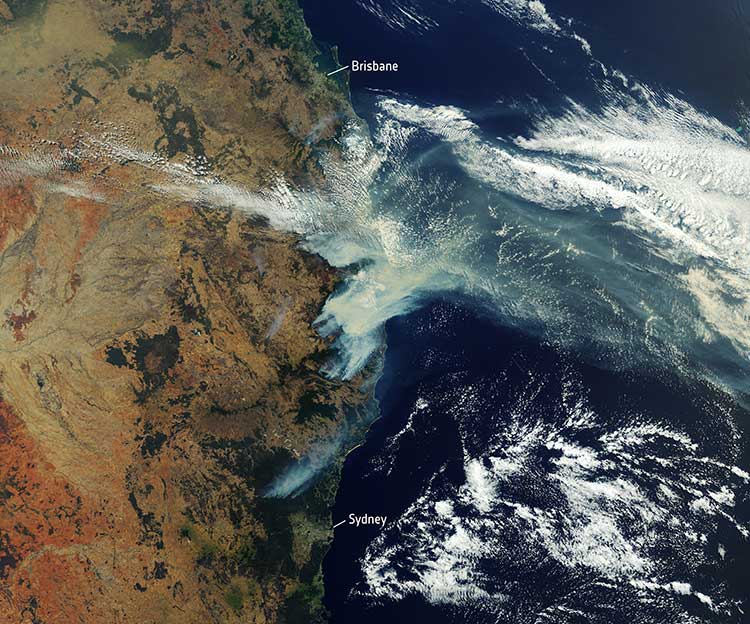
Europe’s Copernicus Sentinel-3 mission has captured the multiple bushfires burning across Australia’s east coast.
In the above image, captured on Nov. 12, 2019, at 23:15 UTC (Nov. 13, 09:15 local time), the fires burning near the coast are visible. Plumes of smoke can be seen drifting east over the Tasman Sea. Hazardous air quality owing to the smoke haze has reached the cities of Sydney and Brisbane.
Flame retardant was dropped in some of Sydney’s suburbs as bushfires approached the city center, and many residents were evacuated. Firefighters continue to keep the blazes under control.
The Copernicus Emergency Management Service – Mapping was activated to help respond to the fires. The service uses satellite observations to help civil protection authorities and, in cases of disaster, the international humanitarian community, respond to emergencies.
Quantifying and monitoring fires is fundamental for the ongoing study of climate, as they have a significant impact on global atmospheric emissions. Data from the Copernicus Sentinel-3 World Fire Atlas shows that there were almost five times as many wildfires in August 2019 compared to August 2018.
Additional images from Worldview-3
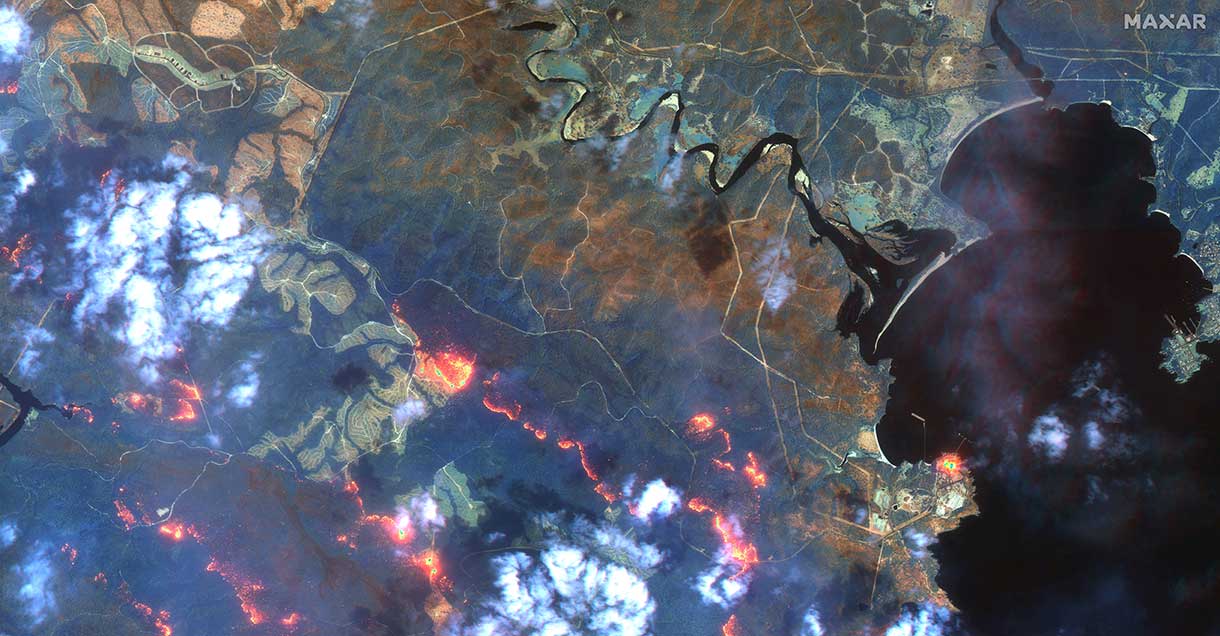
Fireline south of Eden. (Satellite image ©2020 Maxar Technologies)

Fires new Eden. (Satellite image ©2020 Maxar Technologies)
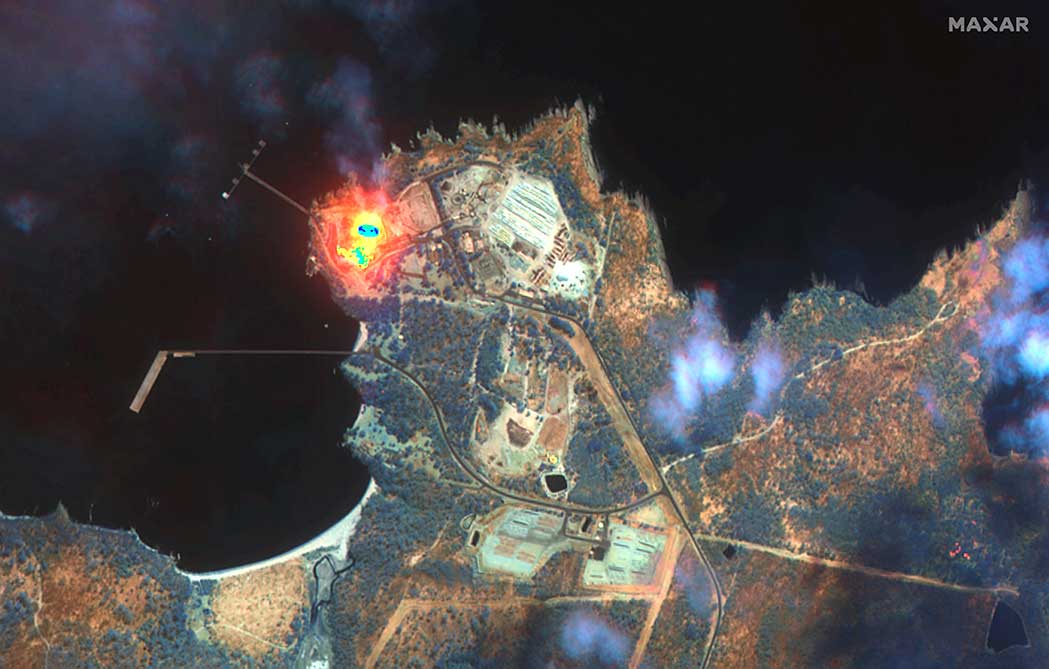
Closeup of fires at Honeysuckle Point south of Eden. (9atellite image ©2020 Maxar Technologies)