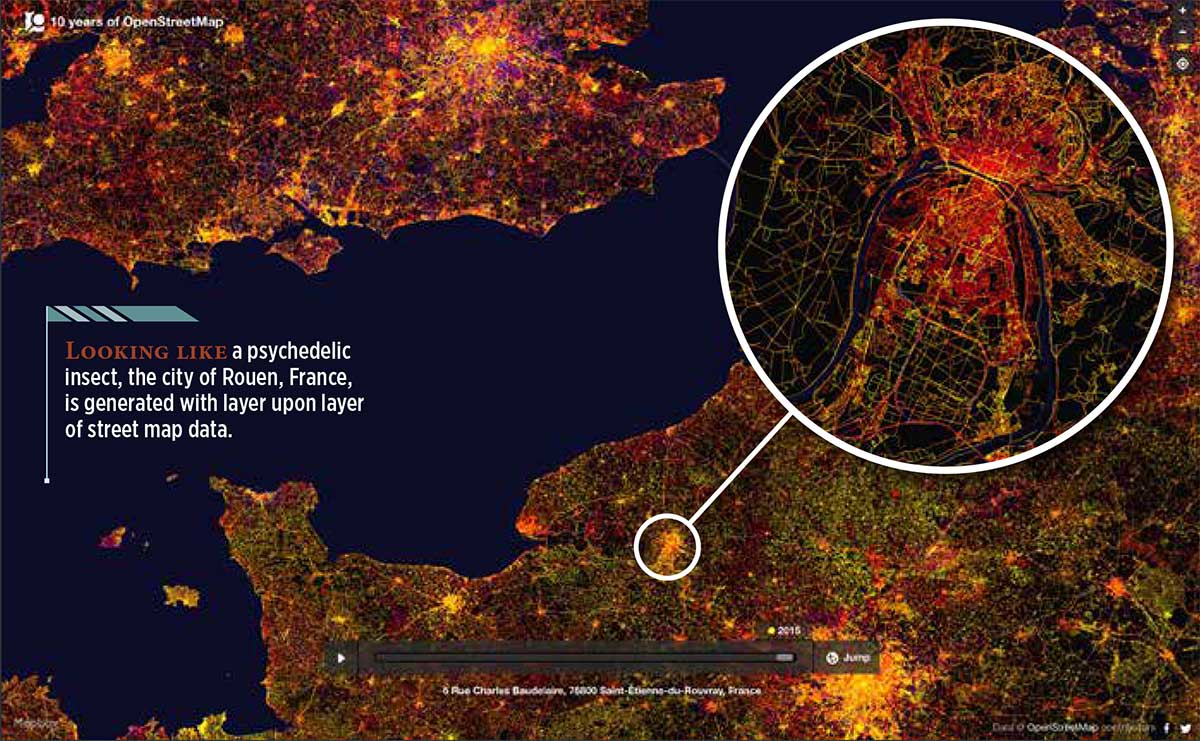
A European region in 2015. (Image: OpenStreetMap)
A tool developed by Mapbox explores “10 years of OpenStreetMap.” During that decade,hundreds of thousands of people mapped 25 million miles of roads in every country in the world.
The internet tool uses a slider to show the data change over time. You can see additions and edits as they come online over the decade — a fascinating look at the intricate information that has been compiled. When a user drags the slider to the left, it’s easy to see how scant the information was only a few years into OpenStreetMap’s existence (the image at right shows the same European region in 2009 as the image at the top in 2015).
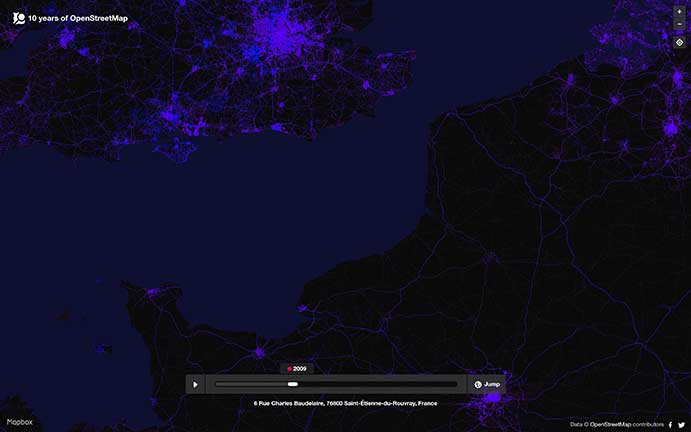
The same European region in 2009 as the image at the top in 2015. (Image: OpenStreetMap)
After GPS and GNSS, OpenStreetMap ranks high in the movement to make geographic information accessible. OpenStreetMap is a community-driven project to create the most detailed, correct and current open map of the world.
When Steve Coast began the project in 2004, map data sources were few, and largely controlled by private companies and the government. Coast changed the rules by creating a wiki-like resource of the entire globe, which everyone could use. Today, 5.2 million people use OpenStreetMap.
OpenStreetMap democratized mapping: all a contributor needed was time and a computer connection to add data about their country or their neighborhood. Besides GNSS, contributors use aerial imagery and low-tech field maps to verify that OSM is accurate and up to date. Others dedicate their energies to humanitarian projects, including disaster response following the Haiti hurricane and aiding South Sudan and Syrian refugees.