Rooftop view of the central parts of Aarhus with the harbor area and the sea in the background. (Photo: DTU Space)
A testbed in an active urban center can show real-world effects on GNSS as an aid for developing autonomous systems for green mobility, smart-city applications or transportation, to name a few.
Sited in Denmark, the 600-square-kilometer Testbed in Aarhus for Precision Positioning and Autonomous Systems (TAPAS) covers both a densely populated city center and suburbs, a large industrial harbor and parts of Aarhus Bay. Aarhus is the second largest city in Denmark with a population of 350,000 people.
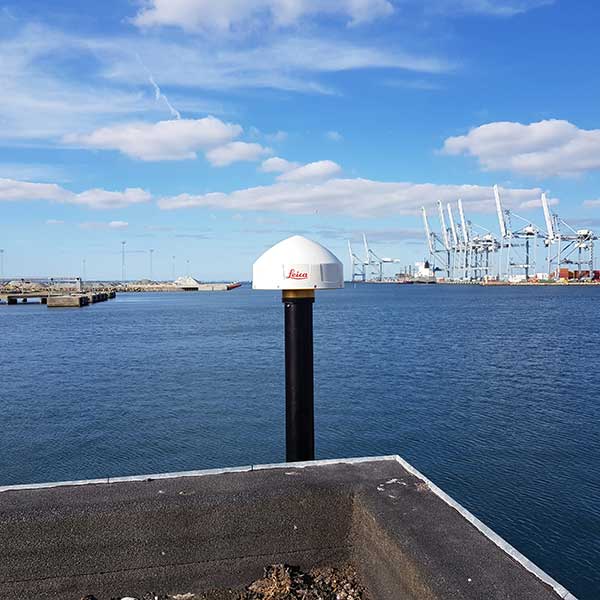
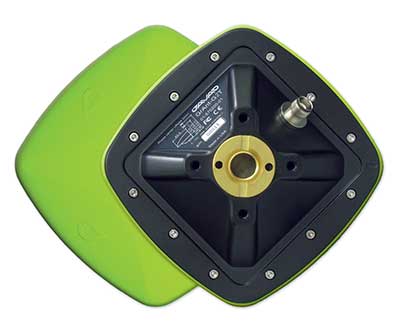
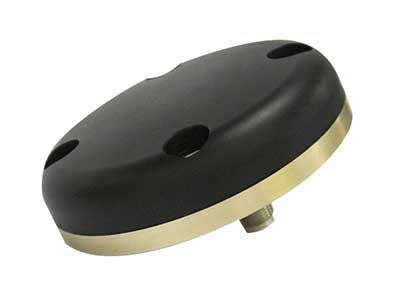
The GNSS antenna at TAPAS station TA01. (Photo: DTU Space)
Based on RTK methodology, TAPAS is a sound ground-based testbed to support, test and validate technological developments with a need for fast, efficient, flexible and reliable precision positioning. It is designed as a geodetic innovation platform, with both physical and virtual networks providing positioning to the centimeter (cm) level.
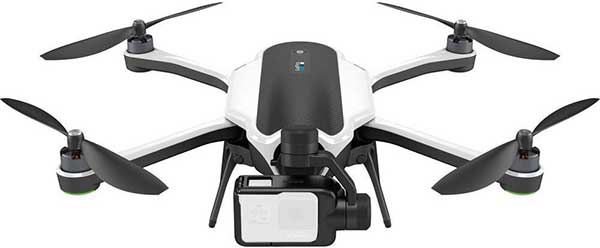
Autonomous systems within transportation, agriculture and environmental monitoring constitute a large growth area for businesses and governments. Automated vehicles, drones and vessels are linked closely to geodetic infrastructure and communications networks such as 5G. TAPAS provides developers in these fields with opportunities to observe GNSS in urban canyons and under canopies, as well as challenges for coastal marine applications. The testbed is available for third-party research projects, and testing of ideas, initiatives and concrete prototypes.
TAPAS is fully funded and owned by the Danish Agency for Data Supply and Efficiency (SDFE), the Danish agency for geodesy and geographical data. TAPAS is developed by the National Space Institute at the Technical University of Denmark (DTU Space), and is supported by the city of Aarhus. The TAPAS testbed was established partly because of Denmark’s National Space Strategy, which points to the new technological development within positioning, as well as possibilities for use of Galileo, the European GNSS, to the benefit of as many citizens as possible.
In this article, we review the TAPAS testbed, including design and installation of the GNSS reference stations and the data-processing center, as well as initial performance testing carried out by DTU Space.
Network of GNSS Reference Stations

The network of TAPAS stations in and around the city of Aarhus in Denmark. (Map: DTU Space)
The basic component of TAPAS is high-accuracy carrier-phase-based GNSS positioning using the network RTK methodology, which can provide real-time position accuracies for the end user down to the cm level.Essentially, TAPAS is based on a network of 11 GNSS reference stations as well as data communication infrastructure, a central processing facility with a data server, processing software and data storage.
TAPAS was designed to provide real-time position uncertainties for objects in motion within 1 cm in three dimensions (1 cubic cm), for end users with modern GNSS equipment. A dense network of GNSS reference stations was originally designed with stations 5 km apart in the city center and up to 10 km apart in the suburbs.
Because suitable locations had to be found, in the final network distances range from 4.1 km to 22.3 km, with the longest distances across the water to station TA04 (see the network plot in the graphic above).
Stations TA01, TA03, TA05, TA06 and TA08 are in the city center. Stations TA02 and TA04 are across Aarhus Bay, ensuring coverage for marine applications and contributing to more robust positioning near the sea and in the harbor area around station TA01.
TAPAS Stations
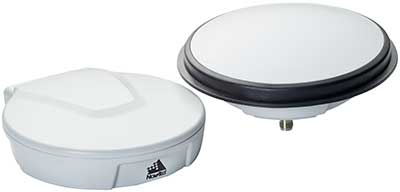
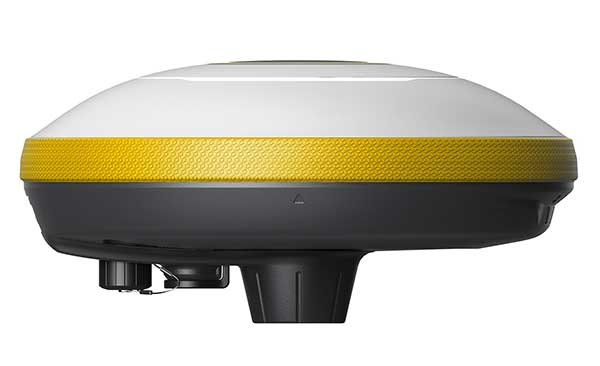
The TAPAS GNSS reference stations are equipped with the newest generation of GNSS receivers and antennas capable of tracking all available signals from the GPS, GLONASS, Galileo and BeiDou systems. The stations also have an antenna splitter, power supply, fuse box, programmable logic controller (PLC) for monitoring and control, trustgate, modem and uninterruptible power supply with battery pack (Figure 1). All units were integrated in the cabinets and tested in the lab before installation The stations are modular and flexible for future iterations and updates.
The receivers can be accessed remotely via a VPN line to a web interface for monitoring, changing settings or firmware updates. All TAPAS stations transmit data to servers at DTU Space where the data is used for estimation of RTK corrections. Also, data is transmitted to servers at the SDFE for storage and backup (Figure 1).
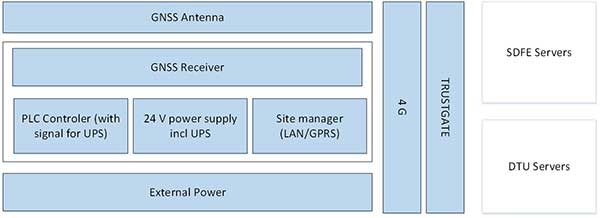
Figure 1. Design schematics of the TAPAS stations. (Image: DTU Space)
After installation in the fall of 2018, GNSS data quality was verified for each station by estimating preliminary positions and analyzing data quality. Also, signal strength as given by the carrier to noise ratio (C/N0) of the received signals was analyzed and plotted with 24 hours of data from each of the stations (Figure 2).

Figure 2. Skyplot of C/N0 values of the L1/E1 signal of the GPS, GLONASS and Galileo constellations plotted for one full day of data from TAPAS station TA11. (Image: DTU Space)
Network Real-Time Kinematic (RTK)
Data from the TAPAS stations streams in real time to the Central Processing Facility (CPF) operated at a dedicated server at DTU Space in Lyngby, North of Copenhagen. The GNSS observations are processed using the GNSMART 2 software from Geo++, where corrections for network RTK positioning are estimated. The corrections are estimates for errors affecting the GNSS positioning, such as inaccuracies in satellite positions and clock drift parameters as well as ionospheric and tropospheric effects. The dense network of reference stations in TAPAS will assure that corrections for the atmospheric effects will be of very high quality.
For estimation of the RTK corrections, standard software settings are used. All corrections are estimated by a state space representation (SSR) technique, where error sources are modeled individually. This means TAPAS can deliver both RTK corrections and corrections for precise point positioning (PPP).
TAPAS corrections are generated in the RTCM format and output using the NTRIP protocol. Registered users can access the corrections through the internet via an NTRIP caster. On the user side, the TAPAS corrections are applied in the positioning process of a GNSS receiver. To make full use of the TAPAS data, user equipment should be capable of tracking carrier-phase-based GNSS data and applying the TAPAS correction data supplied in the RTCM version 3.x format.
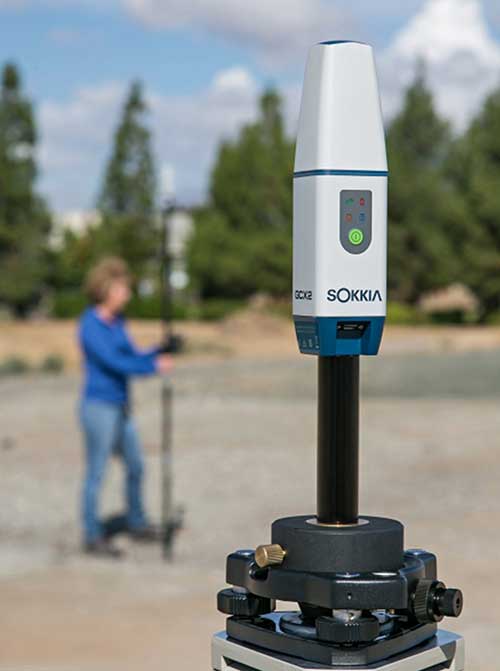
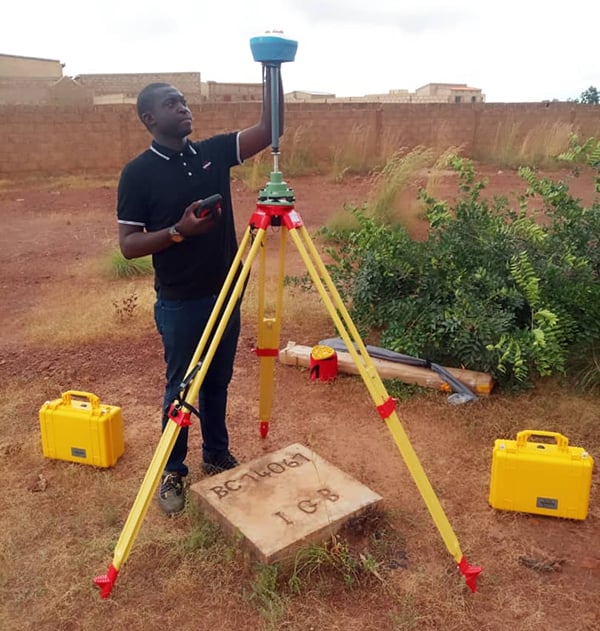
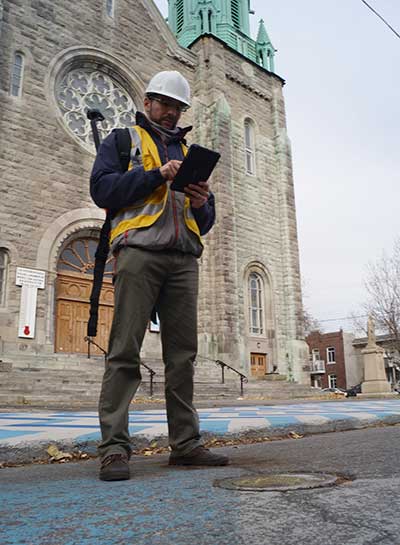
An example of a use of TAPAS is provided in the photo in Figure 9 below where the authors of this article tested the position accuracy of TAPAS for a typical land surveying task, using a Septentrio Altus APS3G receiver with an allegro2 controller unit for RTK positioning. The user’s GNSS equipment can, however, be many other different types and makes of GNSS antennas and receivers, and the equipment can be installed on many different platforms for instance in vehicles, on drones, in robots etc.
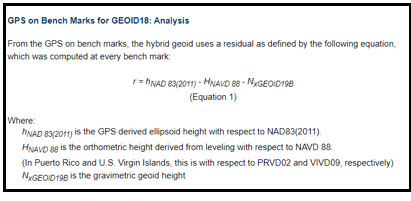
Geodetic Basis
When determining positions with uncertainties at the 1-cm level, it is important to be aware of the geodetic reference frame used for the positioning. In this case, coordinates for the TAPAS stations have been estimated by DTU Space, using Bernese GNSS software, in the national Danish reference frame which is a realization of the European Terrestrial Reference System (ETRS).
When applying corrections from the TAPAS caster in the positioning calculations at the user side, positions will be obtained within the same reference frame (coordinate system). In this case, where the national geodetic reference frame is used, this means that the user will obtain positions compliant with maps, charts and other types of geodata geo-referenced in the same coordinate system.
For 3D positioning, the Danish geoid model must be applied on the user side to obtain heights relative to mean sea level in the national Danish Vertical Reference (DVR90).
It is possible to configure the setup of the central processing facility using another reference frame for TAPAS given that precise coordinates for the TAPAS stations can be provided in the given reference frame. Future work with TAPAS can involve the use of dynamic geodetic reference frames and transmission of coordinate transformation parameters to the users.
Performance Testing
After the stations were installed, DTU Space conducted performance testing, including testing data communication between the TAPAS stations and the TAPAS server, analyses of data completeness from the TAPAS stations, and field tests carried out after the network RTK processing had become sufficiently stable.
Performance test in static mode. In February 2019, a static mode test took place in a park-like area within the three innermost stations. Two different high-accuracy survey-grade RTK-receivers were used for the field test. RTK positions were estimated at 1 Hz for 30 minutes. For each minute, an average position was calculated based on the 60 observations, and for each of the minute-bins the standard deviation with respect to the reference position was computed.
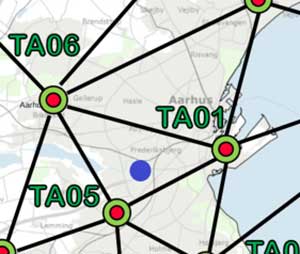
Test location indicated with purple circle in the network plot. (Image: DTU Space)

Altus APS3G unit mounted at the test location. (Photo: DTU Space)
The results are shown in the plots below, where standard deviations are provided for each epoch (i.e., for each bin of 60 seconds).
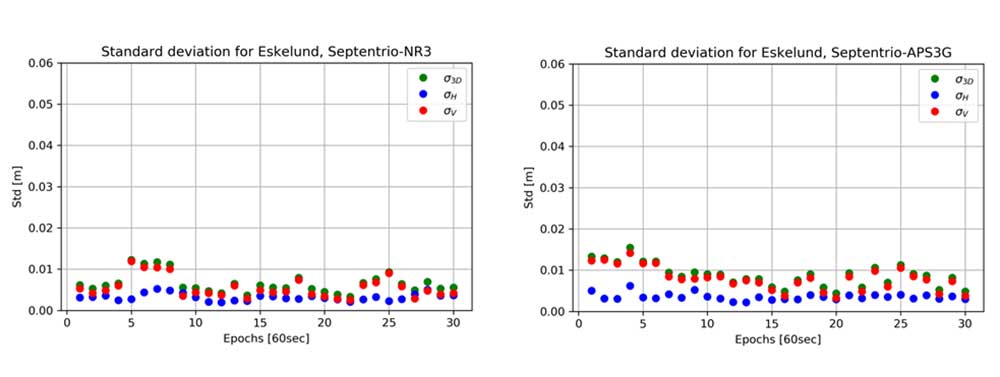
Standard deviation in meter for each 60 second with GNSS receiver Altus NR3 (left) and Altus APS3G (right). Results provided in meter. (Images: DTU Space)
In the plots, results are provided for the vertical (red), the horizontal (blue) and the 3D position (green). Results of using the two different receivers are comparable, and focusing on the 3D solutions the largest standard deviation is 1.6 cm which is for the fourth epoch with receiver APS3G. Most of the 3D results shown in the plots are better than 1 cm.
The same test was carried out using a dual-frequency non-survey-grade receiver developed for machine control and autonomous vehicle applications. This receiver was connected to the same antenna mounted on a tripod. Results of using this receiver in static mode are shown in the plot below. In this case, the 3D results are all better than 3.1 cm, and many of the 3D results are better than 1 cm in this open test area.
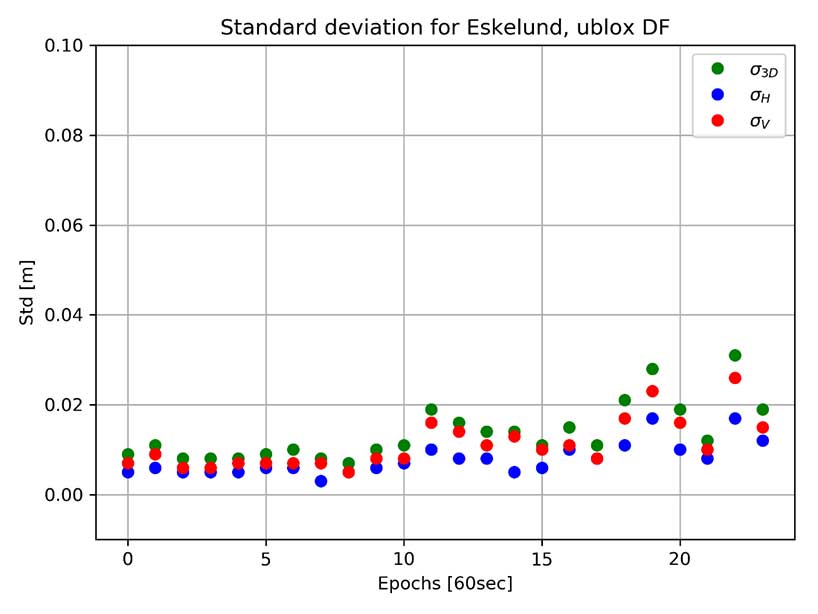
Standard deviation for each 60 second with GNSS receiver u-blox F9P dual frequency (DF). Results provided in meter. (Image: DTU Space)
Performance test in kinematic mode. In the same area used for the static test, a kinematic test was carried out with the same three receivers.
The test was performed using a camera dolly and by placing approximately 10 m of rail on the ground. The camera dolly was pulled back and forth along the rail, a setup that provided a stable trajectory for testing positioning performance while the GNSS antennas were moved slowly and smoothly. A rigid bench, where the GNSS antennas could be mounted, was constructed and installed on the dolly. The three GNSS receivers with antennas were mounted on the bench, and the dolly was pulled back and forth along the tracks 10 times.
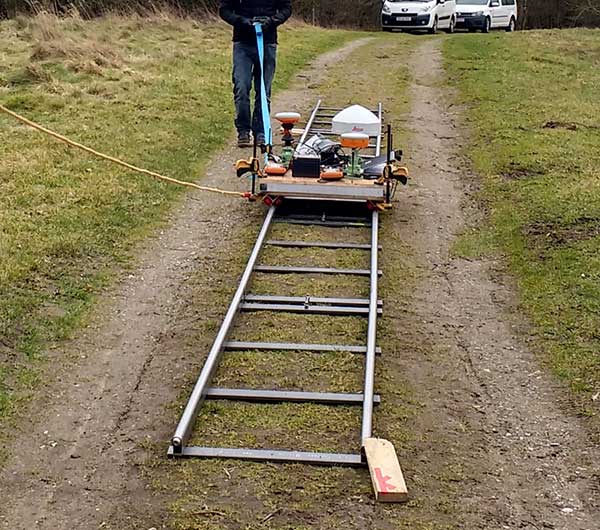
Kinematic Test: Camera dolly with GNSS equipment pulled along tracks. (Photo: DTU Space)
For each 1-meter section of track, the standard deviation of the differences with respect to the reference trajectory of the 10 repetitions was calculated. Results for the two survey-grade receivers are shown in the plots in Figure 3. All of the 3D standard deviations are better than 1 cm for both survey-grade receivers.
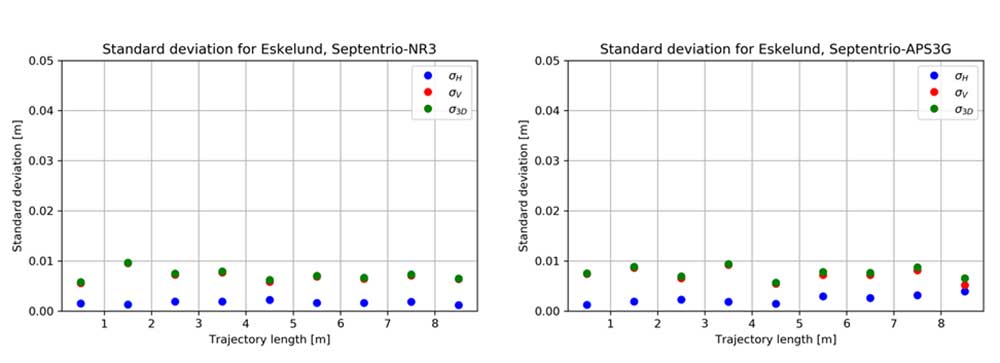
Figure 3. Kinematic test results are provided for the vertical (red), horizontal (blue) and 3D (green) positions. (Image: DTU Space)
The non-survey-grade dual-frequency receiver also was mounted on the test bench, and the results of using this receiver are shown in the plot below. With this receiver, the 3D results are below 2.1 cm for all sections of the trajectory, except for the first meter, a deviation that may have been caused by issues with initialization of the test.
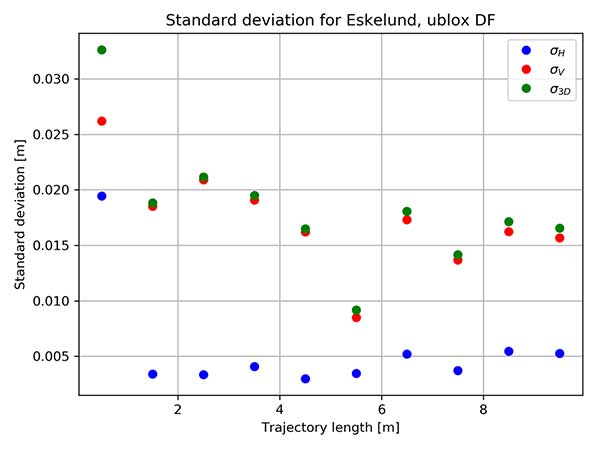
Binned standard deviation of 10 repetitions with GNSS receiver u-blox F9P dual frequency (DF). Results provided in meter. (Image: DTU Space)
These tests show that it is possible when using TAPAS to obtain position solutions at the cm-level in open areas in both static and kinematic mode.
Performance test in dynamic mode. In November 2019, DTU Space carried out a performance test of TAPAS in dynamic mode, using a car with roof-mounted GNSS equipment. The car was driven within the TAPAS coverage area, passing through urban canyons, open streets and the harbor area. During the test, the car drove in normal Aarhus traffic, at speeds varying from zero at traffic lights up to 60 km/h on the wider roads leading into the city center.
Four different receivers were strapped in the car and connected to either a small patch antenna or a survey-grade antenna mounted on the roof. A survey-grade receiver was mounted on the roof.
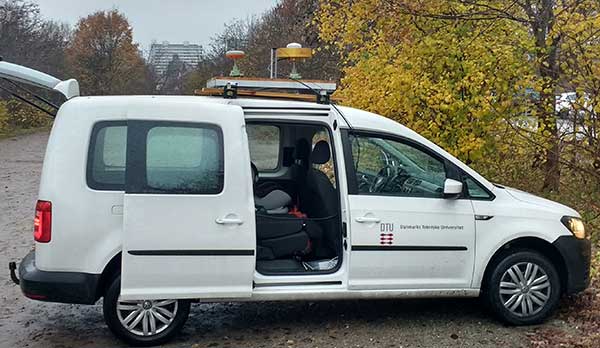
Three different GNSS antennas mounted on the roof of the car used for dynamic testing. (Photo: DTU Space)
Data from the receiver was converted to KML files, which can be used with Google Earth to illustrate the quality of the positioning obtained during the drives through the city. The plot in Figure 4 shows the quality of the position solution. The best quality is obtained when the ambiguities are fixed, such as an RTK fixed solution at the cm level (green). The second-best quality is with ambiguities estimated to float values, such as an RTK float solution at the dm level (purple). Orange shows differential position solutions at the meter level when corrections for the carrier-phase data have not been obtained. Finally, a few positions were stand-alone GNSS solutions when no aiding from TAPAS was applied in the roving GNSS receiver (blue).
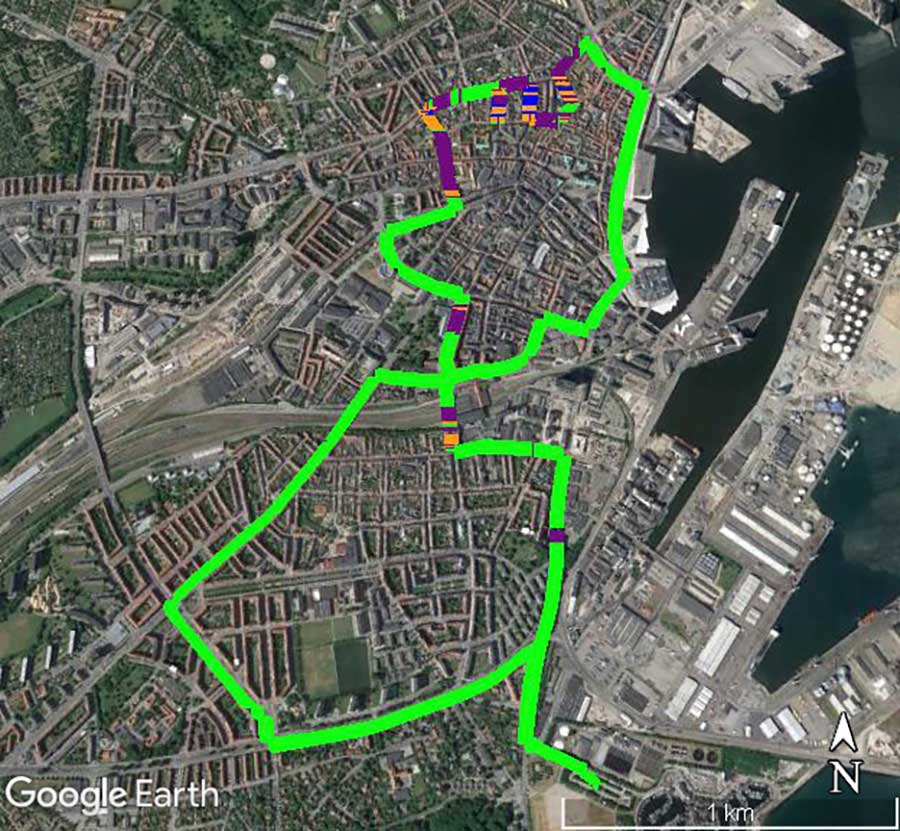
Figure 4. Quality of RTK positions obtained during one drive through the City of Aarhus. (Map data: Google, TerraMetrics)Photo:
The plot clearly shows, as expected, that the quality of the positions determined by the survey-grade receiver in the car is good most of the time. But it suffers in areas with narrow streets aligned with buildings or trees.
These results do not tell the actual uncertainty of the position solutions. But GNSS carrier-phase data collected with one of the receivers in the car during the drive will be post processed to serve as a reference trajectory. Upcoming analyses of the data will then reveal the uncertainty of the positions determined in real time as compared to the post-processed reference trajectory.
Test Conclusion. After the field tests, we conclude that the TAPAS testbed is able to provide correction data that makes it possible to perform GNSS-based positioning in real time in both static and dynamic mode with position uncertainties at the cm-level. Further, as we analyze the test data thoroughly, TAPAS will be able to set a tone for new research. For instance, the plot in Figure 4 provides a foundation for testing assistance procedures to gain better coverage in the most densely built areas. In this way, TAPAS will aid research into feasible infrastructure for the technologies of tomorrow, such as autonomous driving.
Outlook and Future Work
Because TAPAS is not commercial, it is possible, upon agreement with the SDFE, to make changes to the system to adapt to specific testing or development needs. Examples are removing data from some stations in the estimation of RTK correction data, installing an extra receiver in one or more stations using the antenna splitters, or making changes to the settings in data processing on the TAPAS server for shorter time intervals.
At DTU Space, plans for the testbed include further development of software for ionosphere and integrity monitoring. The station receivers can estimate total electron content (TEC) along the GNSS signal path in Earth’s atmosphere, as well as indices for ionospheric scintillation. DTU Space is researching using this output for an ionosphere monitoring service and to develop it into an integrity monitoring service for GNSS users.
Upcoming additions to the RTCM data format will support more advanced modeling of the effects of the ionosphere and troposphere, and this will allow for full benefit of the TAPAS SSR network corrections. Research on such models to be applied on the server side, as well as on the user side, will be carried out by DTU Space and tested with TAPAS as a contribution towards the integration, or hybridising, of PPP and RTK. This is also referred to as PPP-RTK positioning which is expected to be especially useful for mass market applications such as autonomous driving. When implemented in TAPAS, such solution may effectively increase the number of simultaneous users as well as use-cases for TAPAS.
TAPAS provides many opportunities for testing precision or high-accuracy applications, such as autonomous vehicles, vessels, drones and robots; location-based services requiring high accuracy on various digital platforms; and solutions for a more digitized and intelligent city environment through smart-city and green mobility initiatives.
TAPAS is prepared for the implementation of the coming 5G technologies, and station intercommunication capabilities enable testing of internet of things (IoT) technologies where precision positioning is part of the development. The testbed also provides an excellent environment for validation of new services such as the Galileo High Accuracy Service (HAS). Another area in which TAPAS can play an important role is verification and validation of future 5G-based positioning services.
For more on TAPAS, visit www.tapasweb.dk/english.
Acknowledgments
The TAPAS testbed was developed with close cooperation between DTU Space and SDFE. SDFE contributors include Kristian Keller, Casper Jepsen, Henrik Olsen, Martin Skjold Grøntved, Brigitte Rosenkranz, Maria Rask Mylius and Søren Fauerholm Christensen. DTU Space contributers include Ole Bjerregaard Hansen, Finn Bo Madsen, Lars Stenseng, Daniel Haugård Olesen, Stefan Emil Steffensen, Thor Heine Snedker, Per Knudsen and Niels Andersen.
Manufacturers
The GNSS receivers at the TAPAS stations are Septentrio PolaRx5S, and the antennas are Leica AR20. For field testing, a Septentrio Altus NR3 receiver, a Septentrio Altus APS3G receiver and a u-blox ZED F9P dual-frequency receiver were used. The TAPAS station cabinets were assembled and mounted by Nordtec-Optomatic A/S. The TAPAS testbed software solution is based on the GNSMART 2 software package from Geo++ GmbH. Data analyses and processing has been carried out using the Septentrio SBF Analyser and SBF Converter, the RTKlib and the Bernese GNSS software.
Anna B. O. Jensen is senior advisor and team lead of the GNSS group at DTU Space in Denmark. She is also a part-time professor at KTH Royal Institute of Technology in Sweden.
Per Lundahl Thomsen is a chief consultant at DTU Space. He has many years of experience with management of space technology projects and is project manager for the TAPAS testbed.
Søren Skaarup Larsen is a Ph.D. student at DTU Space. Along with his GNSS studies, he runs the RTK-part of the TAPAS testbed.
Gilla detta:
Gilla Laddar in …