Publicerad den Lämna en kommentar

Trimble Dimensions+ opens 2022 Call for Speakers

Photo: Trimble

Photo: Trimble

Trimble has opened its Call for Speakers for the Trimble Dimensions+ 2022 User Conference to be held November 7-9 at the Venetian Resort in Las Vegas.

The Dimensions+ User Conference will promote a variety of sessions highlighting groundbreaking technology that can be used to transform work and push for a sustainable future. Speakers will have the opportunity to share their industry experiences and insights with peers from around the globe. The conference will also provide an Offsite Experience where attendees can learn how professionals are using the latest technologies to create a safer, greener and more productive work environment.

Session topics will include autonomy; building design, construction and operation; civil engineering and infrastructure; forensics; forestry; local, state and federal government; land administration; mapping and GIS; marine construction; mobile mapping; monitoring; photogrammetry and remote sensing; scanning; surveying; utilities; sustainability and more.

Proposals for speakers will be accepted through March 31, 2022 and notifications of acceptance will be made in the following months. Proposals can be submitted here.

To register for the conference or learn about sponsorship opportunities, visit Trimble’s website.

Publicerad den Lämna en kommentar

The effects of tectonic plate movement on the modernized 2022 NSRS

It’s the beginning of 2022 and the new, modernized NSRS is only about three years away. Hopefully, everyone has been reading NGS’s blueprint documents updated during 2021, and participating in NGS’s webinar series. Together, they provide the latest information about the changes from the existing NSRS to the new NSRS.

My previous columns highlighted many aspects of the new geometric reference frame and geopotential datum. In this month’s column, I will highlight the time-dependent aspect of the modernized NSRS and why it is necessary for the new system.

As I stated before, NOAA’s National Geodetic Survey (NGS) is developing models and tools for users to be able to transform coordinates between the four national terrestrial reference frames and the International Terrestrial Reference Frame, the Geopotential Datum and the North American Vertical Datum of 1988 (NAVD 88), as well as estimate coordinates at epochs different from the survey observation epoch by accounting for movement.

What does NGS mean by estimate coordinates at epochs different from the survey epoch, and why is it necessary to account for movement for the new, modernized NSRS? This column will address these issues.

NGS’s January 2022 (Issue 27) edition of NSRS Modernization News announced a paper about the modernized NSRS and a change in name to the Intra-Frame Velocity Model (IFVM). See the box below. Users can sign up for these newsletters here,  and can obtain access to previous newsletters here.

The Latest Issue of
NSRS Modernization News

Image: From GovDelivery Communications Cloud on behalf of: NOAA's National Ocean Service)

Image from GovDelivery Communications Cloud on behalf of NOAA’s National Ocean Service.

The new paper was published in October 2021 and is titled “The Mathematical Relation between IFVM2022 as Expressed in ITRF2020 with IFVM2022 as Expressed in the Four Terrestrial Reference Frames of the Modernized NSRS with Dependence on EPP2022.” It can be downloaded here.

The paper describes the mathematical relationship between the Intra-Frame Velocity Model (IFVM2022) and the Euler Pole Parameters (EPP2022).

The NSRS Modernization News announcement states that the IFVM2022 name has been changed to the Intra-Frame Deformation Model (IFDM2022). The latest version of blueprint 1 and the October 2021 (NOS NGS 90) report were published before the name changes, so they refer to IFVM2022 instead of IFDM2022.

Photo:

Why is it necessary to account for movement? Coordinates basically change because the Earth’s surface is moving due to the movement of major tectonic plates. See the box below for information about why it is called plate movement or tectonic shift. NGS understands this and is attempting to manage the changing coordinates by providing a time-dependent component.
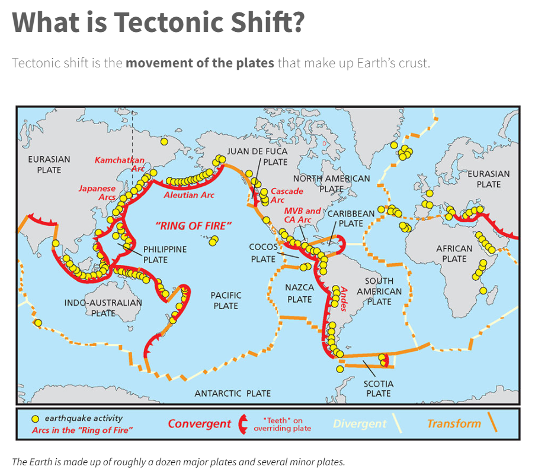
Image: National Ocean Service Website

Image: National Ocean Service website

Screenshot: NOAA Website

Screenshot: NOAA Website

NGS will be defining the following four geometric terrestrial reference frames that are based on the tectonic plates (see map below):

  • North American Terrestrial Reference Frame of 2022 (NATRF2022)
  • Pacific Terrestrial Reference Frame of 2022 (PATRF2022)
  • Caribbean Terrestrial Reference Frame of 2022 (CATRF2022)
  • Mariana Terrestrial Reference Frame of 2022 (MATRF2022)

Four Tectonic Plates Part of NGS’s New NSRS
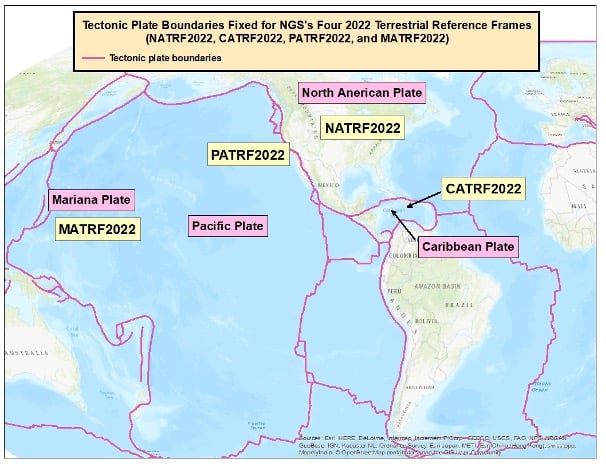
Image: Dave Zilkoski

Image: Dave Zilkoski

As previously stated, NGS is developing models and tools for users to be able to transform coordinates between the four national frames and the International Terrestrial Reference Frame, as well as estimate coordinates at epochs different from the survey observation epoch by accounting for movement. These models are denoted as EPP2022 and IFDM2022.

So, what are EPP2022 and IFDM2022? And what does this mean to surveyors and mappers?

EPP stands for Euler pole parameters (a way of describing a plate’s rotation) and IFDM2022 is a way of computing the drift in coordinates.

Why Euler Pole? See the box titled “Who was Euler?”

Who was Euler?

Leonhard Euler was a Swiss who lived in the 1700s. He was one of the greatest mathematicians that ever lived and has been called the greatest mathematician of the 18th century. He founded the studies of graph theory and topology, and made pioneering and influential discoveries in many other branches of mathematics such as infinitesimal calculus. He introduced a lot of modern mathematical terminology and notation, including the notion of a mathematical function. He is also known for his work in mechanics, fluid dynamics, optics, astronomy and music theory.

The definition of Euler’s fixed point theorem states that any motion of a rigid body on the surface of a sphere may be represented as a rotation about an appropriately chosen rotation pole, called a Euler pole. This theorem has been used by geologists to understand and describe the motions of tectonic plates.

NGS’s 2021 revised Blueprint 1, NOAA Technical Report NOS NGS 62, Blueprint for the Modernized NSRS, Part 1: Geometric Coordinates and Terrestrial Reference Frames provides an explanation of Euler poles and “plate-fixed” frames. As stated in the “Who was Euler?” box, the definition of Euler’s fixed-point theorem states that any motion of a rigid body on the surface of a sphere may be represented as a rotation about an appropriately chosen rotation pole, called a Euler pole. The following is stated in the NOS NGS 62 report under “Plate-Fixed Frames and Euler Poles,” section 4:

When considering only the rigid (not deforming) part of a tectonic plate, the horizontal motion of the plate (relative to a global plate-independent reference frame, like the ITRF) can be modeled as a rotation about a geocentric axis passing through a fixed point on Earth’s surface. Although such models must make certain assumptions (such as the rigidity of the plate), the dominant motion of the majority of points on most tectonic plates is the rotation about a fixed point. That point is known as an “Euler pole.”

What is important to know is that the determination of a plate’s Euler pole location and the angular velocity with which the plate rotates can be empirically determined using GNSS observations from a CORS network distributed throughout the plate. Figure 1 from the NOS NGS 62 report provides a plot of the North American plate Euler pole and the vectors of the horizontal velocities at select CORS (see the box titled “Figure 1 from NOS NGS 62”).
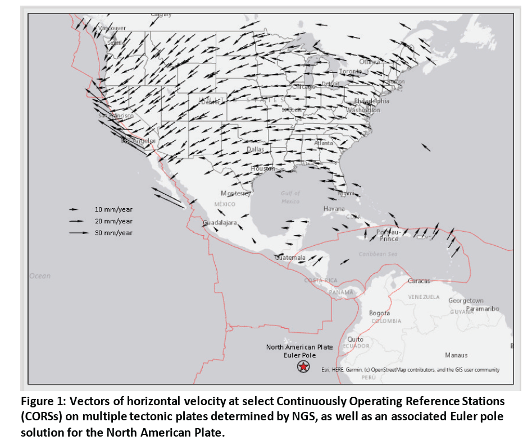
Figure 1 from NOS NGS 62

Photo: NGS Website

Photo: NGS website

Every place on Earth is moving. That includes neighboring marks on the same tectonic plate. What this means is that after the Eulerian motions are removed, the remaining motions left over change the relative differences in coordinates of neighboring marks located on the same tectonic plate. Figures 2 and 3 from the NOS NGS 62 report provide plots of estimates of these remaining velocities (see the boxes titled “Figure 2 from NOS NGS 62” and “Figure 3 from NOS NGS 62.”)

Figure 2 is a plot of the non-Eulerian motions east of 110° west longitudes. As stated in the report, most of the velocities are less than 2 mm/year. The concept is that the EPP2022 and IVDM2022 models will remove the Eulerian and non-Eulerian movement of the marks.

Figure 2 from NOS NGS 62

Image: NGS Website

Image: NGS website

Figure 3 is a plot of non-Eulerian vectors west of 110° west longitude. As indicated in the plot, the large vectors in Western California, Western Oregon and Western Washington show areas of deformation near plate boundaries that don’t appear to be adequately captured just from the North American plate rotation.

Figure 3 from NOS NGS 62
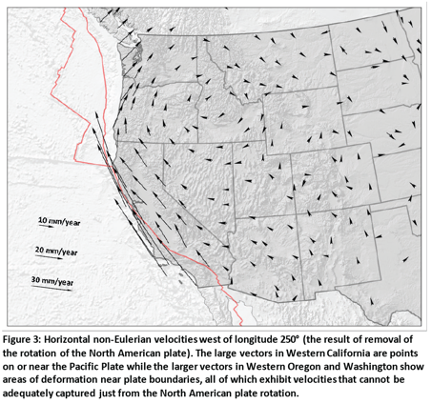
Image: NGS Website

Image: NGS website

It should be noted that the size of the vectors on Figures 2 and 3 depict a different magnitude of movement. Figure 2 depicts vectors at 1-3 mm/year and Figure 3 depicts movement at 10-30 mm/year.

To better visualize the potential size of the movement, I downloaded the CORS ITRF2014 coordinates and velocities from NGS’s website and compiled the results. See the boxes titled “CORS ITRF 2014 Horizontal Velocities” and “Table of ITRF 2014 Horizontal and Upward Velocities of U.S. CORSs.”

CORS ITRF 2014 Horizontal Velocities

Computed Velocities Only (Downloaded Jan. 13, 2022)
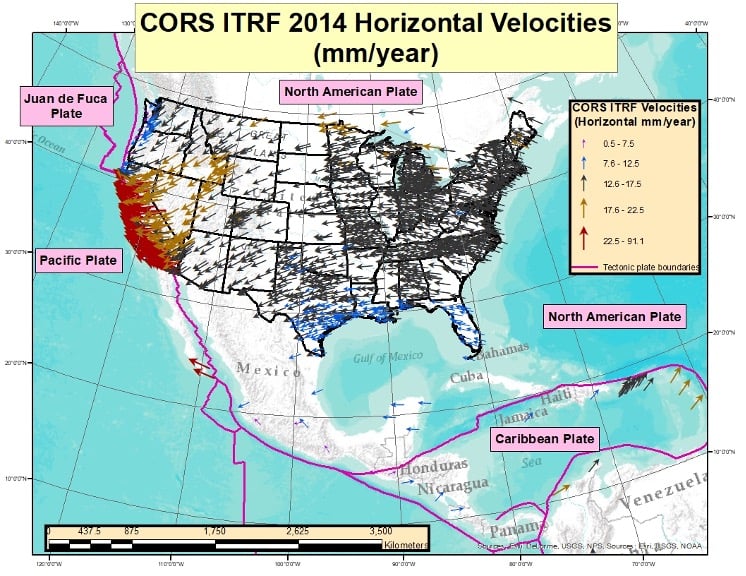
Image: Dave Zilkoski

Image: Dave Zilkoski

The box titled “CORS ITRF 2014 Horizontal Velocities” provides the horizontal vectors based on NGS’s file downloaded on Jan.13. Only CORSs designated as operational and computed velocities were included in the plot.

I have also created a table that includes a summary of the ITRF rates for CORS labeled as part of the United States. The table includes the following information for each State and Territory of the United States:

  1. Number of CORS
  2. Minimum Horizontal Velocity (mm/year)
  3. Maximum Horizontal Velocity (mm/year)
  4. Average Horizontal Velocity (mm/year)
  5. Minimum Upward Velocity (mm/year
  6. Maximum Upward Velocity (mm/year),
  7. Average Upward Velocity (mm/year).

See the table below.

Table of ITRF 2014 Horizontal and Upward Velocities of U.S. CORSs

Computed Velocities Only (Downloaded Jan. 13, 2022)
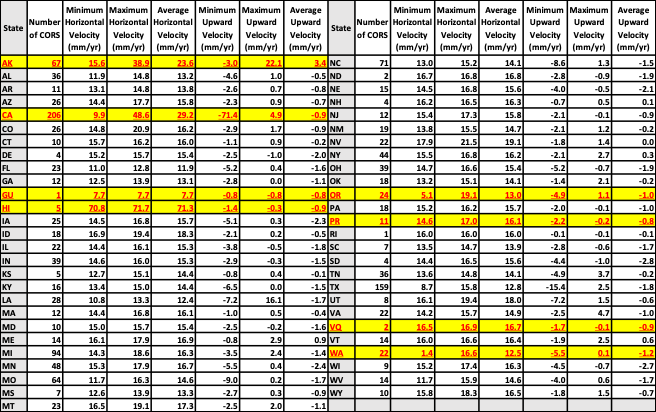
Highlighted Territories are not on the North American Plate (GU, HI, PR, and VQ) and higlighted States are partly inside or close to the boundary of the North American Plate and another tectonic plate (AK, CA, OR, WA).

Highlighted territories are not on the North American plate (GU, HI, PR, and VQ), and highlighted states are partly inside or close to the boundary of the North American plate and another tectonic plate (AK, CA, OR, WA).

The highlighted territories in the table are not on the North American plate (GU, HI, PR and VQ), and the highlighted states are partly inside or close to the boundary of the North American plate (CA, OR, WA). This is one of the reasons why their minimum and maximum horizontal velocity values are different from most of the other states’ values.

To visualize the relative differences in horizontal velocities between neighboring CORSs, I plotted the ITRF 2014 Horizontal Velocities for CORSs located in North Carolina (see the box titled “CORS ITRF 2014 Horizontal Velocities in North Carolina”). Looking at the figure, it’s obvious that all of the velocities are around 14 mm/year and moving in the same direction.

CORS ITRF 2014 Horizontal Velocities in North Carolina

Computed Velocities Only (Downloaded Jan. 13, 2022)
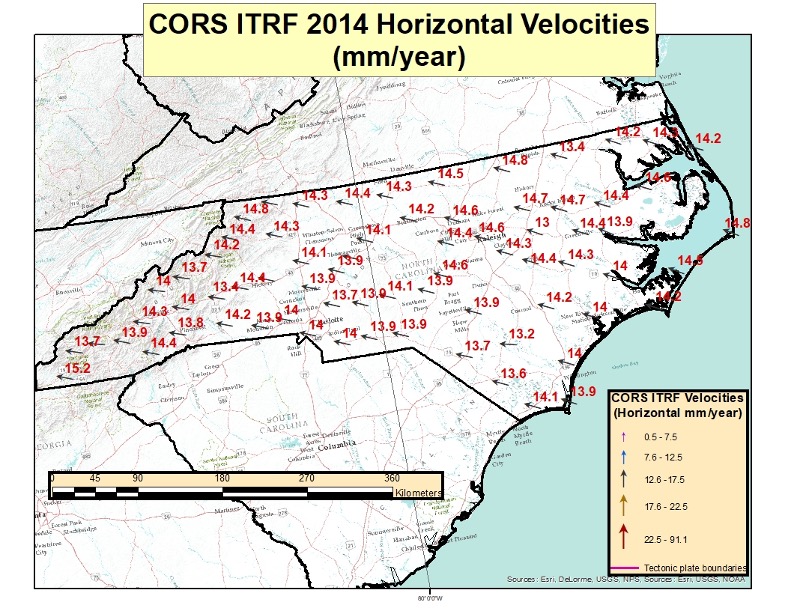
Photo: Dave Zilkoski

Screenshot: Dave Zilkoski

I plotted the horizontal velocities for Missouri to provide an example of the velocities in the central region of the conterminous United States. The magnitude of the velocities is similar to that for North Carolina, but the direction of the vector is slightly different. North Carolina’s average horizontal velocity is 14.1 mm/year and Missouri’s average horizontal velocity is 14.6 mm/year.

CORS ITRF 2014 Horizontal Velocities in Missouri

Computed Velocities Only (Downloaded Jan. 13, 2022)
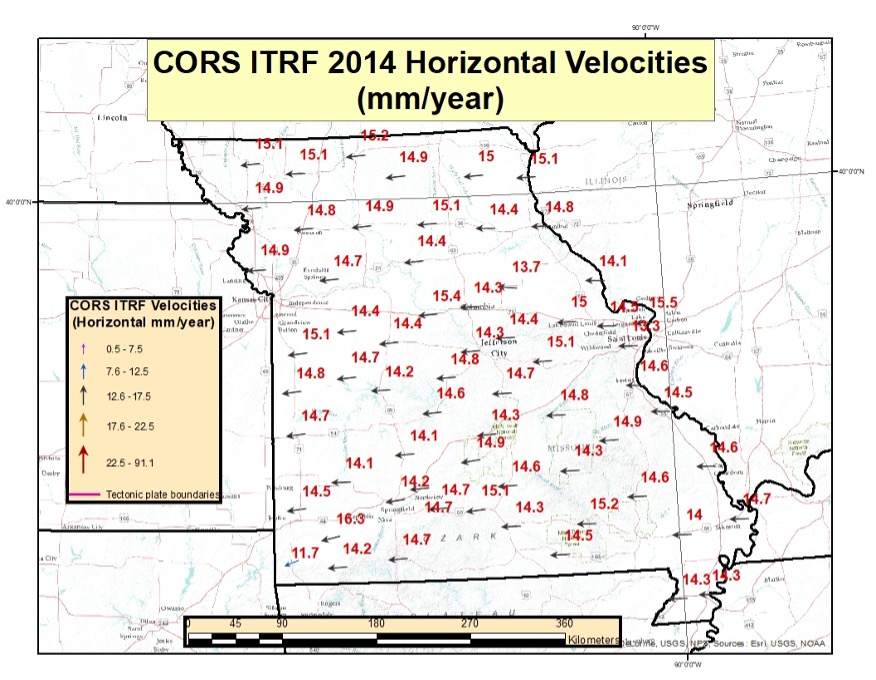
Image: Dave Zilkoski

Image: Dave Zilkoski

To emphasize the differences along the boundaries of the tectonic plates, I’ve included a plot of the CORS ITRF 2014 horizontal velocities for the State of Oregon and a plot of the states along the West Coast of the United States. See the boxes titled “CORS ITRF 2014 Horizontal Velocities in Oregon” and “CORS ITRF 2014 Horizontal Velocities Along West Coast of CONUS.” As indicated in the plot, there are significant changes in horizontal velocities near the Oregon coast. The values decreased by about 10 mm/year from the inland CORS to the CORS along the coast.

CORS ITRF 2014 Horizontal Velocities in Oregon

Computed Velocities Only (Downloaded Jan. 13, 2022)
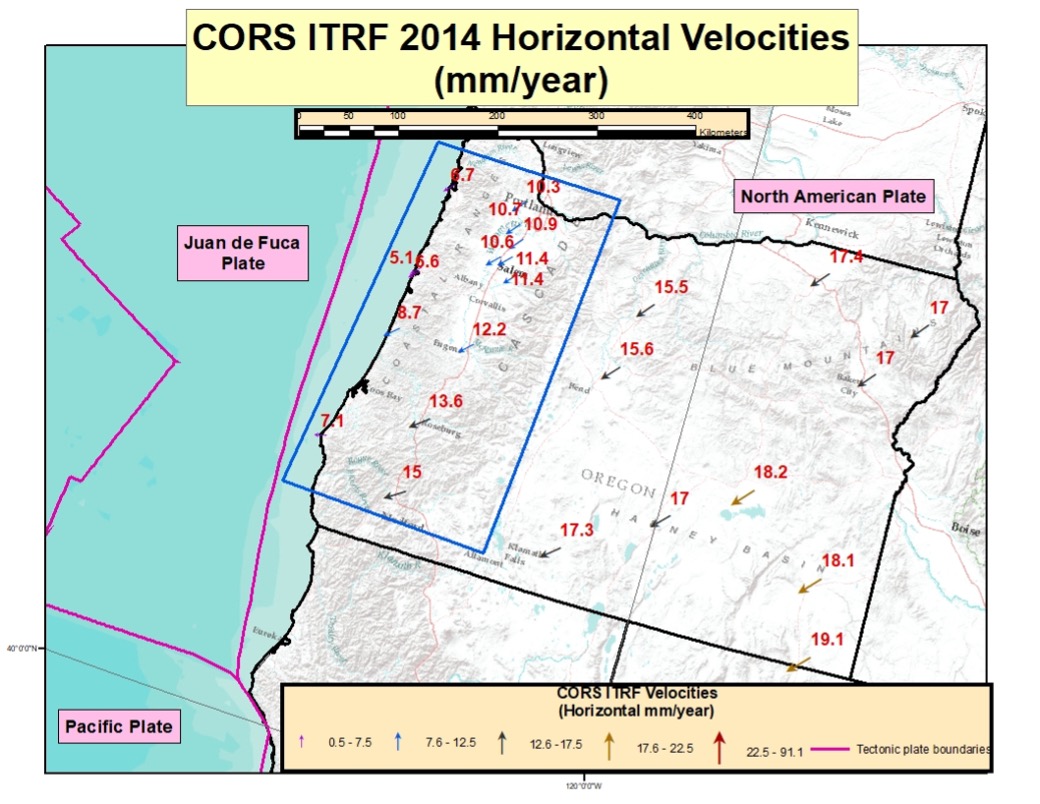
Image: David Zilkoski

Image: Dave Zilkoski

The plot of the CORS ITRF 2014 Horizontal Velocities Along West Coast of CONUS clearly indicates the change in magnitude the closer the CORS are to the Pacific and Juan de Fuca plates.

CORS ITRF 2014 Horizontal Velocities Along West Coast of CONUS

Computed Velocities Only (Downloaded Jan. 13, 2022)
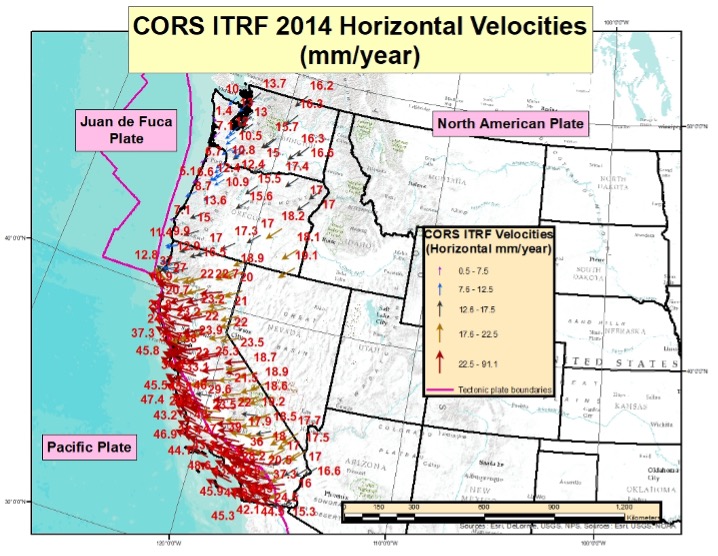
Image: David Zilkoski

Image: Dave Zilkoski

For completeness, I’ve also included a plot of the horizontal velocities for Alaska.

CORS ITRF 2014 Horizontal Velocities in Alaska

Computed Velocities Only (Downloaded Jan. 13, 2022)
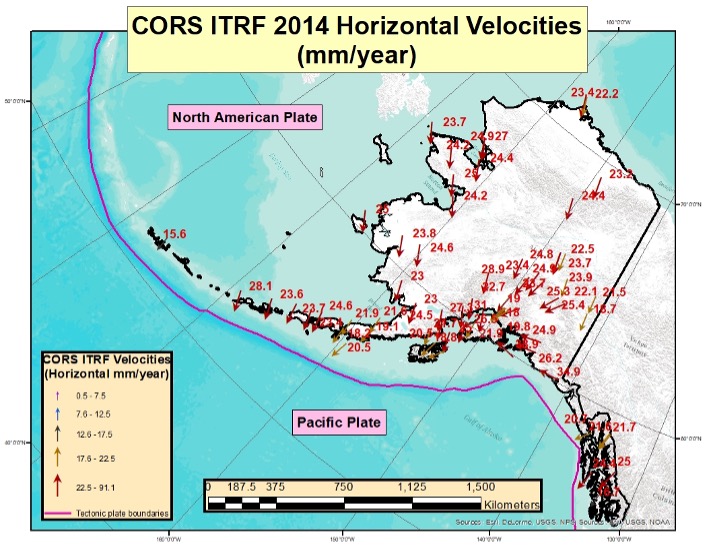
Image: David Zilkoski

Image: Dave Zilkoski

To better visualize the horizontal and upward velocities of CORS among states, I plotted the average horizontal and upward velocity value for each state based on that states’ CORS. See the box titled “Average Velocities by State.”

Average Velocities by State

Image: David Zilkoski

Image: Dave Zilkoski

I also computed an average horizontal velocity value based on CONUS CORS east of 110° west longitude (denoted here as a regional horizontal velocity value). [I used the CORSs east of 110° west longitude to be consistent with NGS’s Figure 2 in NOS NGS 62.]

The box below summarizes the average horizontal motion for each state. The table provides:

  1. The Number of CORS East of 110° West Longitude
  2. Average Horizontal Velocity (mm/year)
  3. Average Horizontal Velocity minus Regional Horizontal Velocity (mm/year).

This provides an estimate of the variation of the relative horizontal motion between States.

Table of ITRF 2014 Horizontal Velocities minus Regional Velocity of U.S. CORS East of 110° West Longitude
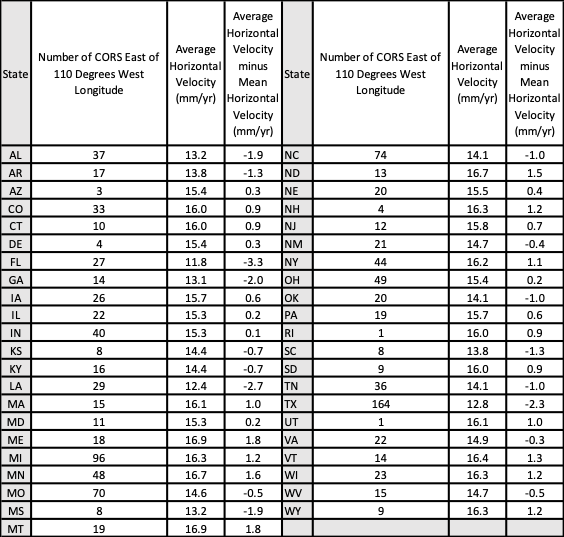
Image: David Zilkoski

Table only includes CORS East of 110° West Longitude (Image: Dave Zilkoski)

The box titled “Horizontal Velocities in NC Minus Average Velocity” depicts the resulting horizontal velocities with an average velocity removed (the average velocity was based on NC CORS only) for all CORS in North Carolina. As one can see from the plot, most of the resulting horizontal velocities are less than 1 mm/year, but they are still not zero. Once again, this is only meant to provide an idea of the size of the relative vectors between CORS in North Carolina.

As indicated in the NOS NGS 62 report, these horizontal velocities will be small, but they will not be zero. Hence the reason that NGS needs to provide models and tools for users to be able to transform coordinates between the four national frames (NATRF, PATRF, CATRF and MATRF) and the International Terrestrial Reference Frame (ITRF), as well as to estimate coordinates at epochs different from the survey observation epoch by accounting for movement within the reference frame. Surveyors in California have been dealing with these types of movements for many years now.

Horizontal Velocities in NC Minus Average Velocity

(Downloaded Jan. 13, 2022)
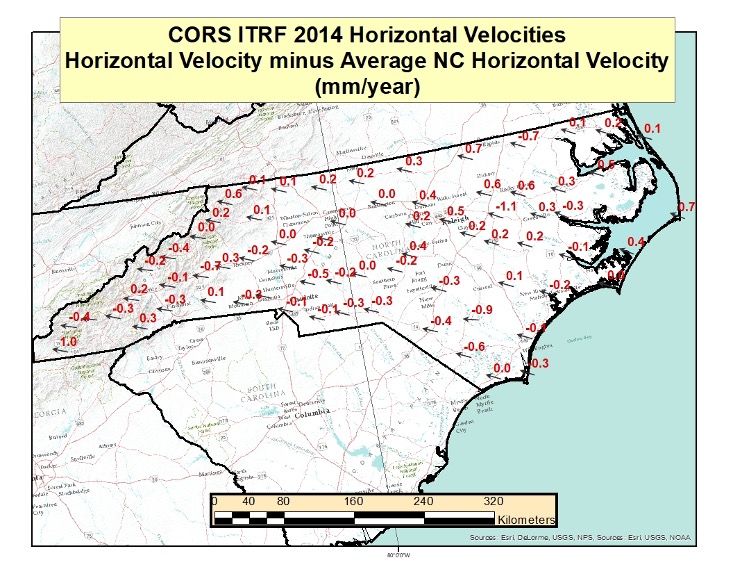
Image: David Zilkoski

Image: Dave Zilkoski

I plotted the ITRF 2014 upward velocity values of the CORS in North Carolina to depict an estimate of the vertical movement of the CORS in North Carolina. See the box below. The vertical velocities values are much less than the horizontal velocities, but they still are not zero. A future column will address the upward velocities based on the ITRF 2014 rates and crustal movement models.

CORS ITRF 2014 Upward Velocities in North Carolina

(Downloaded Jan. 13, 2022)
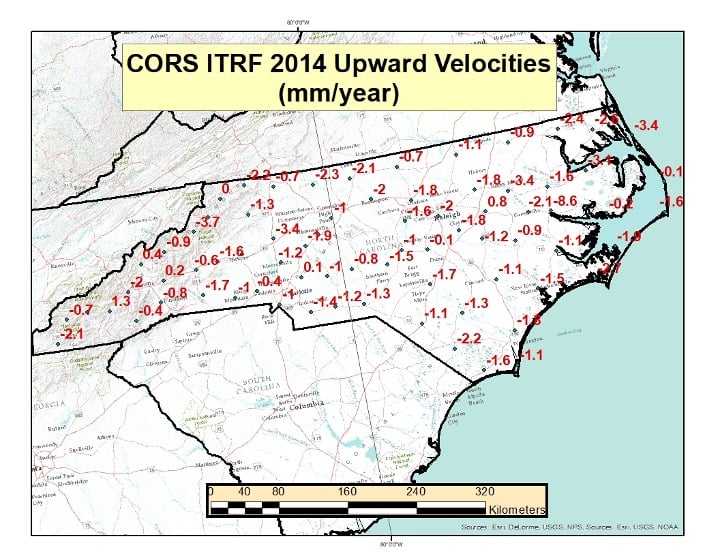
Image: Dave Zilkoski

Image: Dave Zilkoski

This column explained why it is important to account for movement of marks everywhere and not just in areas influenced by active crustal movement due to earthquakes such as in Southern California. It provided information about the CORS rates of movement based on NGS’s ITRF2014 coordinates and velocity information. It highlighted NGS’s reports that describe models that will facilitate users transferring coordinates between reference frames and dealing with intra-frame movement between marks based on survey performed at different epochs. This is not just a horizontal positioning issue.

A future column will address estimates of vertical velocities in the new, modernized NSRS.

Publicerad den Lämna en kommentar

Rohde & Schwarz provides testing to meet Europe’s E112 requirements

Rohde & Schwarz adds an extension to its R&S TS-LBS location-based services test system to meet 112 emergency-call regulations for smartphones

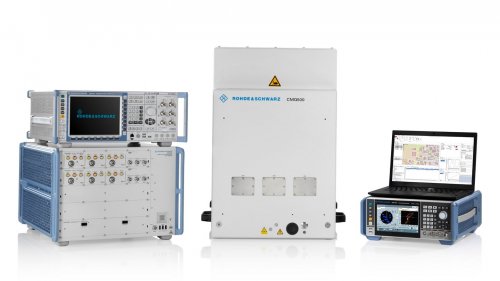
E112 emergency caller location tests are now available on the R&S TS-LBS test system. (Photo: Rohde & Schwarz)

E112 emergency caller location tests are now available on the R&S TS-LBS test system. (Photo: Rohde & Schwarz)

A new regulation requires all smartphones sold in the European Union from March 2022 onwards to support caller location for 112 emergency calls. To ensure this feature, the devices must be compliant with several positioning systems as outlined by the European Commission.

In response, Rohde & Schwarz has added an extension to its R&S TS-LBS location-based services test system. Certification service provider CETECOM has already started E112 testing using these test sequences.

All smartphones sold in the European Union have to be compliant as of March 17 with the Delegated Regulation (EU) 2019/320. A supplement to Radio Equipment Directive (RED) 2014/53/EU, it defines that 112 emergency calls provide caller location information to emergency services in a fast and accurate way, to make sure first responders can arrive at the site of an accident quickly.

Instead of a harmonized standard, a guideline document from the European Commission recommends the testing procedures for Notified Bodies, who support the smartphone vendors in the conformance assessment procedure. Compliance with Galileo, advanced mobile location (AML) and Wi-Fi positioning will be mandatory.

The software-based extension to the R&S TS-LBS location-based services test system makes it a tailored solution in line with the European Commission’s guideline document and the upcoming ETSI standard TS 103 825 for AML protocol testing.

In the Rohde & Schwarz solution, the cellular network is emulated by the R&S CMW500 wideband radio communication tester, while the dual-frequency E1+E5 GNSS Galileo signal is generated by an R&S SMBV100B vector signal generator. Thanks to the automation software of the test setup, all the test cases described in the EC guideline can be executed automatically to ensure unified, fast and repeatable results.

Publicerad den Lämna en kommentar

Beagle Systems launches first station in country-wide drone network

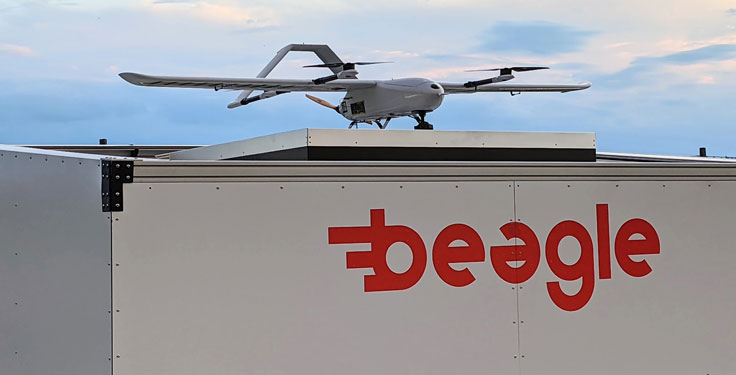
Photo: Beagle

Photo: Beagle

Hamburg-based start-up Beagle Systems has begun building a nationwide network of landing and charging stations for drones.

In Hanstedt (Lüneburger Heide) in the Lower Saxony region of Germany, the first hangar has been set up with an unmanned aerial system (UAS). From there, every surrounding place in Lower Saxony can be reached in a short time.

The drone will be deployed from the Beagle Systems headquarters in Hamburg. Beagle Systems has the corresponding permits for flights beyond visual line of sight (BVLOS).

“The start in Hanstedt is an important step for us,” said Oliver Lichtenstein, one of the three founders of Beagle Systems. “From here we can reach an area of 780,000 hectares in Lower Saxony. As the first provider of drone flights, we are thus on call within a short time at the customer’s site.”

The drone flight can be controlled entirely from Hamburg; on-site personnel deployment is not necessary. This eliminates personnel costs as well as time spent traveling to and from the site. Because of this, Beagle Systems can carry out drone flights at a much lower cost than other providers.

“Our goal is to build a nationwide network of charging stations within the next few years,” said Mitja Wittersheim, COO of Beagle Systems. “An EU-wide expansion is then the next step.” The expansion of the network would allow drone specialists to access a ready-to-go drone from Hamburg for customers at any location within the European Union.

Beagle Systems is a drone-as-a-service provider specializing in long-range flights with unmanned aerial systems. The drones are already in use for the inspection and monitoring of large infrastructure facilities such as power grids.

The company also plans to tap into the multi-billion dollar market of delivery, courier and express services. The Beagle M drone used in Hanstedt was developed in-house. It has a wingspan of 2.50 meters and can transport a load of up to three kilograms.

Publicerad den Lämna en kommentar

Research firm Intqlabs files patent on magnetic field location tech

Image: Credit: Petrovich9/iStock/Getty Images Plus/Getty Images

Image: Credit: Petrovich9/iStock/Getty Images Plus/Getty Images

Dubai-based Intelligent Quantum Labs (Intqlabs) has announced that its latest proprietary technology of enabling location data solely from the Earth’s geomagnetic strength is now patent pending (UAE patent office application 202111049994).

Leveraging more than two decades of experience in developing antennas, sensors, radio analysis platforms and computing algorithms, the new technology incorporates advanced processes to calculate power profile data from magnetic readings. The power profile enables calculation of a location under water, in the air or on the ground within a few seconds.

The technology, dubbed New Global Navigation Satellite System (NGNSS), was developed to serve as an alternative to existing GNSS platforms such as GPS, GLONASS, Galileo, Beidou, QZSS and IRNSS. NGNSS does not depend on satellite constellation and is not susceptible to being jammed, injected, replayed or spoofed.

NGNSS operates on the core principle that every point on Earth’s surface and in its atmosphere has a uniquely calculable magnetic strength reading, or a geomagnetic force. This force changes based on distance from the poles, elevation, altitude, time of day, direction of sunlight, magnetosphere, earthquakes, inner core rotation, crust, declination, inclination, ionosphere, magnetosphere, and gyrations that occur in continuity such as solar storms, elevation, topography, altitude changes, spherical variations and regional anomalies

NGNSS removes interference and noise from geomagnetic readings by using a specialized array of aligned multiple input multiple output (MIMO) antennas connected to a complex network of embedded processors, extremely sensitive fluxgate sensors and other sensors. The antenna and embedded setup processes the magnetic strength reading to obtain the power profile, split the various signals in a profile, and then calculate the direction, origin and location of these sources. This enables NGNSS to identify the true strength of the Earth’s geomagnetic field by removing all sources of interference.

NGNSS is a secure platform unaffected by jamming, replay or injection as it monitors power profiles and simply drops the malicious data. Furthermore, NGNSS is independent of the GNSS constellations, making it a standalone, secure and “always available” platform that can be integrated within any electronic terminal by strategically embedding a chip and antenna.

Publicerad den Lämna en kommentar

Nearmap appoints new chief financial officer

Penny Diamantakiou

Penny Diamantakiou

Nearmap Ltd. has appointed Penny Diamantakiou as chief financial officer (CFO) effective Jan. 31. The announcement follows the promotion of Andy Watt to chief growth and operations officer.

Diamantakiou has had a distinguished career spanning more than 20 years as a business executive with a passion for digital, media and technology businesses. Previously the CFO of 5B, a clean technology leader that accelerates access to low- cost, safely deployed, solar energy, Diamantakiou has also held leadership roles at companies including Optus, Yahoo7, WooliesX (part of the Woolworths Group) and the Association for Data-Driven Marketing & Advertising (ADMA).

Diamantakiou is a graduate of the Australian Institute of Company Directors, holds a master’s degree in business administration (an MBA), a graduate diploma in management, and a bachelor’s in economics. She is also a Fellow Certified Practicing Accountant (FCPA).

“It gives me great pleasure to welcome Penny to the team at Nearmap,” said CEO Rob Newman. “Penny will start from a strong foundation of fiscal management, reporting and transparency established by Andy, and will take our systems forward as we increasingly manage more products, customers and geographies.”

“Just as importantly, Penny shares our core values, and given her passion, commitment and extensive leadership experience working at high growth digital and technology-led businesses, is the right cultural fit to help drive our business and strategy forward,” Newman said. “I look forward to working together as we continue growing our business and expanding our market leadership position.”

Publicerad den Lämna en kommentar

Satellite-driven farming

Precision agriculture — which promises to reduce inputs of water, fertilizers and pesticides by matching them to variations in soil conditions, thereby reducing environmental impacts, while increasing yields and productivity and reducing fuel consumption —has been around for a long time. This magazine published a few issues of a special supplement on the subject more than 20 years ago. In recent years, the convergence of enabling technologies — including improved satellite-based sensors, unmanned aerial vehicles, ground-based sensors, and GNSS corrections services — and greater demand has made agriculture one of the largest users of GNSS.

Compared to autonomous vehicles on public roads, autonomous tractors, sprayers, combines, and other farming equipment pose much lower safety concerns, because they need not deal with the vagaries of traffic, accidents and construction. They also are not subject to the kind of signal occultation and multipath that is the bane of GNSS navigation in urban canyons and, at least for now, they are not at significant risk of jamming or spoofing. However, they face other challenges, including severe roll and pitch due to bumpy terrain, some multipath from silos and other tall structures, occasional signal interference, occasional dense tree canopies, the requirement to maintain exact heading at very low speeds, the need to receive corrections over very large areas, complicated weather conditions (including rain, fog and dust clouds) and, like every other sector, cost constraints.

Despite this, guidance for farm vehicles must be consistently accurate at the decimeter-level, lest the machines damage the valuable crops that they are designed to service.

In the following articles, seven companies briefly describe their advancements in precision agriculture:

Advanced Navigation robots take to the field

CHC Navigation provides affordable auto-steering

Harxon & Hexagon | NovAtel’s Smart Antenna rides steady on uneven ground

Hexagon | NovAtel keeps rows straight despite the weather

Septentrio’s careful tractors weeding vineyards

Trimble weeds out the uninvited guests in the field

Unicore’s position accuracy matters for all farm tasks

Featured Photo: Trimble

Publicerad den Lämna en kommentar

Unicore’s position accuracy matters for all farm tasks

Photo: Unicore

Photo: Unicore

Although GNSS has been applied in agriculture for many years, farmers still encounter challenges caused by GNSS. No matter the farm task — planting, spraying, harvesting or specialized applications such as robotic grass mowing — position accuracy matters.
Here are the most common issues farmers have and how Unicore’s products help.

  • Under canopy. They are unable to get a fix under heavy foliage canopy because the real-time correction signal is interrupted or “shaded out” by the canopy. Unicore is launching two new modules that will help mitigate this problem.
  • Loss of lock. At times, the receivers lose lock or get large position errors when the ionosphere’s effects are severe. Driven by a full-constellation and full-frequency RTK engine, Unicore’s RTK algorithm takes advantage of triple and quad frequency observables, effectively mitigating ionospheric residuals.
  • Loss of 4G signals. RTK can provide real-time centimeter-level high-precision positioning, which requires real-time base station data. In practical applications, radio or wireless network communication is often interrupted. During the interruption of the base station data, RTK’s positioning accuracy decreases quickly. Unicore’s RTK KEEP technology can maintain the centimeter-level positioning accuracy for more than 10 minutes after the interruption.
  • Lack of CORS stations. It is challenging to provide a stable high accuracy position for an ultra-long baseline. With the mitigation of ionospheric and tropospheric delays, Unicore products’ RTK baseline can be extended to up to 50 kilometers.

The UM980 is Unicore’s new-generation high-precision RTK positioning module, supporting full constellation and full-frequency. Relying on the strengths of high reliability, precise positioning accuracy and low latency, UM980 is not only well suited for high-precision surveying and mapping, but also a good choice for rover or base station receivers in agriculture.

The UM982 is a dual-antenna high-precision positioning and heading module. Since its master and slave antennas can simultaneously track all the frequencies of all the GNSS systems, the UM982 performs fast on-chip RTK positioning and dual-antenna heading solutions without the need to initialize the IMU. Featuring great positioning performance and stability, the UM982 is a perfect choice for high-precision agriculture applications, such as drones, autonomous tractors and autonomous lawnmowers.

Both products will be available in June 2022.

Publicerad den Lämna en kommentar

Trimble weeds out the uninvited guests in the field

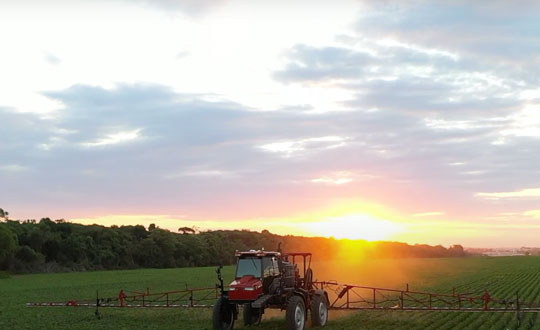
Photo: Trimble

Photo: Trimble

Controlling weeds is a natural challenge in agriculture. The cost of controlling these unwanted plants is also one of the most expensive line items in a farmer’s budget. For third-generation Brazilian farmer Ivan Bedin, trying to rid his 8,620-hectare soybean and corn farm of hearty weeds has been a costly challenge.

“Typically, we’ve had to blanket spray weed-killing chemicals throughout the entire farm,” Bedin said. “Even if only 15% or 20% of the area was weed-infested, we had to spray the total area. We were spending more than $145,000 a year on chemicals, and it wasn’t good for the environment.”

The Bedin family then acquired Trimble’s WeedSeeker 2 technology. This intelligent spot-spray system senses whether a weed is present and signals a spray nozzle to deliver a precise amount of chemical, spraying only the weed. By targeting resistant weeds individually, WeedSeeker 2 can reduce the amount of herbicides used by up to 90%, promoting sustainability and cost savings on the farm.

While driving 18–20 km/hr, the sprayer’s operator focuses on the WeedSeeker application while the AutoPilot system guides the sprayer. As he drives between crop rows, optical sensors distinguish the green of the crop from the green weed and release herbicide just on the weed. From inside the cab, the operator can monitor the spray system and adjust any application parameters in real time. With the reliability of the steering technology and the efficiency of WeedSeeker, Bedin has been able to reduce refueling time and cover his entire field 30% faster than with his conventional system.

Most importantly, the technology has significantly slashed his weed-chemical expense. “WeedSeeker 2 has yielded us nearly 90% savings in herbicide costs,” said Bedin. “Now we only need to spray between 10% to 30% of the farm — where the weeds actually grow — which equals a savings of about $70,000 for each 1,000 hectares sprayed. Additionally, because we use less herbicide, we impact the environment less.”

Because the spot-spray system logs and maps every weed sprayed, Bedin can also see in real time where there are weed infestations and review the detailed maps before the next spray. With the “seek and destroy” premise of WeedSeeker 2, Bedin’s formidable weeds may have finally met their match.

Publicerad den Lämna en kommentar

How could your tractor be so careful?

Photo: Septentrio

Photo: Septentrio

On a French vineyard in the Loire Valley, a tractor is driving between the grape vines with no one behind the wheel. Meet TREKTOR, the autonomous hybrid robot that works tirelessly to weed the organic vineyard producing some of the finest Gamay wine, called Anjou Gamay Village.

After TREKTOR worked the land for a month, its developer, a company called Sitia, reviewed the quality of their autonomous robot’s work. They counted grape vines damaged during operation — two in one month — and approached the farmer to reconcile the liability. To Sitia’s surprise, he responded, “When I use my manual tractor to get the same job done, I damage at least two vines a day! How did your tractor manage to be so careful?” Sitia’s developers thought for a while and then replied, “It’s thanks to the high quality and accuracy of the components that are inside.”

“Despite the strong magnetic field emitted by the generator on the TREKTOR, the AsteRx SB ProDirect receiver did not have any issues,” said Clément Aubry-Tardif, Sitia’s R&D manager. “The spectrum analyzer in its web interface showed other small radio interferences aboard the robot, but everything was still working fine.”

Integrated into the TREKTOR is an AsteRx SB ProDirect dual-antenna receiver, which provides the reliable high-accuracy positioning and heading needed for autonomous operation. Sitia chose the receiver for the following reasons.

  • It has centimeter-level accuracy with RTK, which reduces crop damage and increases yields.
  • Its heading helps point implements in the right direction. Unlike inertial systems, it’s reliable and accurate even in static or slow-moving applications.
  • Built-in advanced interference mitigation (AIM+) technology makes it resistant to radio interference, while its LOCK+ technology ensures robust satellite tracking even under intense vibrations or shocks.
  • It includes an intuitive web interface for fast prototyping and easy real-time testing.

Sitia is a French company specializing in autonomous robots. Its TREKTOR helps compensate for the current farmer shortage, which is especially felt on organic farms, where weeding is seven times more labor intensive due to the use of few (if any) herbicides. TREKTOR is a flexible solution that can adjust its height and width on the fly, adapting to various working environments. It can also change implements to perform various functions. Depending on TREKTOR’s dimensions and implements, the distance from the crop to the robot changes, making high-accuracy positioning crucial to minimize damage to any of the crops.